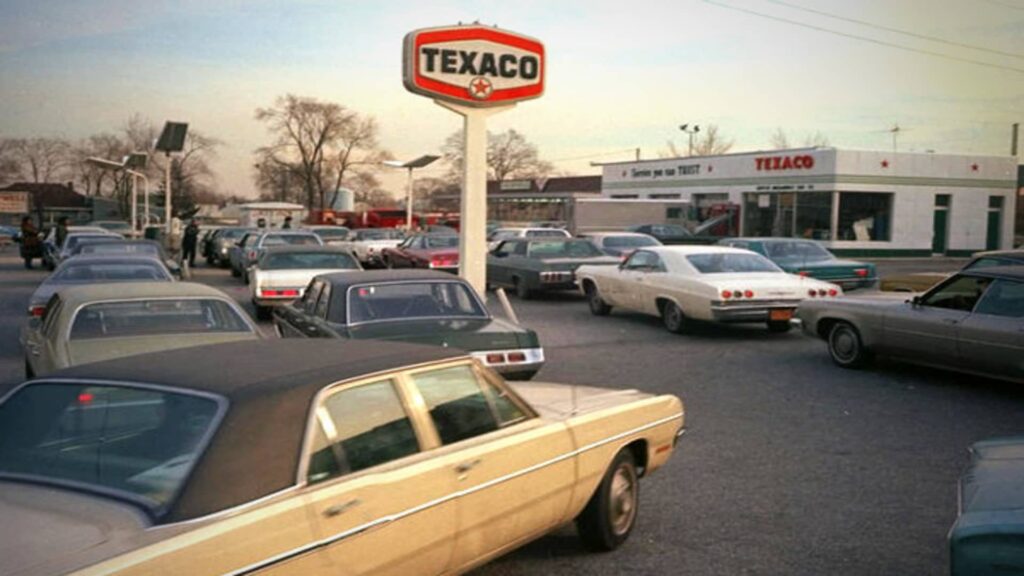
Just as in the 1970s, an inflation pattern is forming on consumer price charts, a potentially troubling indicator for financial markets. Peter Cawley, chief market strategist at Pave Finance, said investors should look at what the Federal Reserve’s recommended inflation measures look like now and compare them to those under Presidents Nixon, Ford and Carter. The core consumer spending price index, which excludes volatile food and energy prices, is currently down about 3%. So far, it has not returned to the Fed’s 2% annual rate, after spiking toward 5.5% early in the pandemic. This is eerily similar to the 1970s, when the same pattern led to a disastrous period for the stock market. Inflation also rose above 5% at the time, headed back toward 3%, but was hit by the 1973 Arab oil embargo and the end of President Nixon’s wage and price controls, eventually rising above 10% from 1972 to 1974. As a result, stock prices plummeted, with the Nasdaq Composite Index plummeting 31% in 1973 and another 35% in 1974. “Before the next big rise in inflation, an inflation pattern exactly like what happened in the 1970s is forming,” Corey wrote on CNBC. A Unique History Admittedly, there are some major caveats to this idea. First, a major cause of inflation at the time was the soaring price of crude oil. Currently, oil prices may fall in the fourth quarter as more supplies come online from OPEC+ countries. “It doesn’t necessarily mean that inflation will automatically rise because the circumstances were different back then,” Mr. Cawley said. However, Corey believes that a second wave of inflation could still occur in our time. He pointed to other striking similarities between now and then, including threats to the Federal Reserve’s independence that could force central banks to cut interest rates just as inflation comes back to a head. Recent economic data suggests a weakening labor market and a slight rise in inflation, but not enough to cause a rift in the stock market. But in the long run, energy costs could once again be an ominous market killer. Virtually no one expects oil prices to be as high as they were in the two 1970s oil price spikes (one due to the 1973 embargo and the other due to the Iranian revolution in 1979), but today’s outlook for electricity prices is not so bright. Aging electricity transmission and distribution infrastructure, as well as a surge in power demand from artificial intelligence data centers, have driven electricity prices above inflation since 2022 and are expected to continue at that pace until at least 2026. Unfortunately, due to the government shutdown, Wall Street is now operating blind on federal economic data. The Washington government shutdown since Oct. 1 has already delayed the September nonfarm payrolls report on Oct. 3, according to the Bureau of Labor Statistics, and will likely disrupt this Thursday’s release of the September producer price report and next week’s consumer price index, originally scheduled for Friday, Oct. 24. Importantly for stocks, rising inflation, which would compound the rising price pressures of the past few years, could also damage consumer confidence, potentially curbing spending, which accounts for about two-thirds of the economy, while boosting future price expectations, which could be self-fulfilling, Khoury said. “My base case is that we’re starting to get into stagflation. That’s my base case,” Corey said, referring to economic conditions in the 1970s when growth was slow and inflation was high. “I don’t know if the stock market will agree with me next month, but we’ll find out someday.” — CNBC’s Gabriel Cortez contributed to this report.

